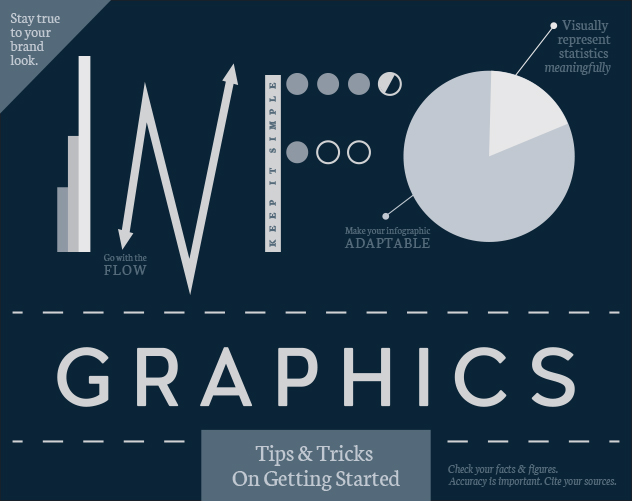
Tips for a Meaningful Infographic
TIPS FOR A MEANINGFUL INFOGRAPHIC Many people claim to hate statistics. What most people mean by that is, they don’t enjoy running statistical analyses, but people love to see/hear the final outcome of statistical analyses and love to be able to put numerical values to data. One trend that combines information (statistics) and visual graphics, are infographics. Info + graphics = infographics. However, the ability to understand the given data/information, and make it visually appealing is one for artists [...]


